Welkom op de weersite van Veghel e.o.
Veghelsweer probeert u zo goed mogelijk van juiste weerdata te voorzien.
|
Temperatuur: 20,5°C |
Wind:  W W2 Bft Lichte wind 9,7 km/h |
Neerslag: Vandaag 0,0 mm |
Vochtigheid: 58% |
Luchtdruk: Bestendig 1023,9 hPa |
- Het actuele weer
- Vooruitzicht

- Neerslag
- Statistics
- Actueel weer
- Wind
- Zon/maan/aarde
- Stel je eigen voorkeuren in
- Meer radars/kaarten
- Meer verwachtingen
- Historie / almanak
- Andersoortige informatie
- Inspecteer weervelden
Webcam Veghel
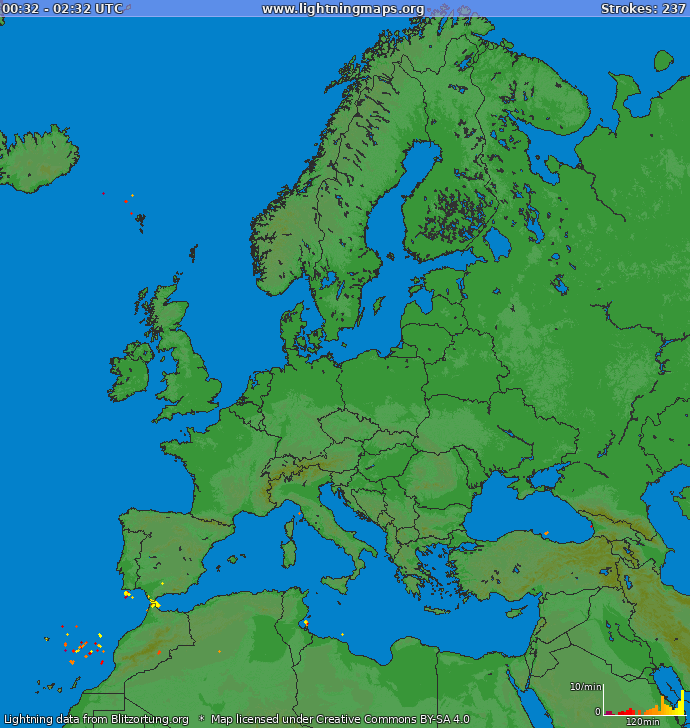
Onweer radar

U vindt ons ook hier:


Space Weather Observations, Alerts, and Forecast
Forecast text
:Product: 3-Day Forecast
:Issued: 2026 Jul 21 1230 UTC
# Prepared by the U.S. Dept. of Commerce, NOAA, Space Weather Prediction Center
#
A. NOAA Geomagnetic Activity Observation and Forecast

The greatest observed 3 hr Kp over the past 24 hours was 4 (below NOAA
Scale levels).
The greatest expected 3 hr Kp for Jul 21-Jul 23 2026 is 5.33 (NOAA Scale
G1).

NOAA Kp index breakdown Jul 21-Jul 23 2026

             Jul 21       Jul 22       Jul 23
00-03UT       2.33         3.67         4.00
03-06UT       2.67         5.00 (G1)    3.00
06-09UT       3.00         5.33 (G1)    2.67
09-12UT       3.67         4.00         2.00
12-15UT       4.33         3.67         2.00
15-18UT       2.67         3.33         2.67
18-21UT       2.33         3.00         3.00
21-00UT       3.00         4.33         3.00

Rationale: G1 (Minor) geomagnetic storms are likely on 22 Jul due to
negative polarity coronal hole high speed stream effects.

B. NOAA Solar Radiation Activity Observation and Forecast

Solar radiation, as observed by NOAA GOES-18 over the past 24 hours, was
below S-scale storm level thresholds.

Solar Radiation Storm Forecast for Jul 21-Jul 23 2026

              Jul 21  Jul 22  Jul 23
S1 or greater    5%      5%      5%

Rationale: No S1 (Minor) or greater solar radiation storms are expected.
No significant active region activity favorable for radiation storm
production is forecast.

C. NOAA Radio Blackout Activity and Forecast

Radio blackouts reaching the R1 levels were observed over the past 24
hours. The largest was at Jul 20 2026 2225 UTC.

Radio Blackout Forecast for Jul 21-Jul 23 2026

              Jul 21        Jul 22        Jul 23
R1-R2           55%           55%           55%
R3 or greater    5%            5%            5%

Rationale: Solar activity is expected to be low with further M-class
flares (R1-R2, Minor-Moderate) likely on 21-23 Jul primarily due to the
flare potential of AR 4493.
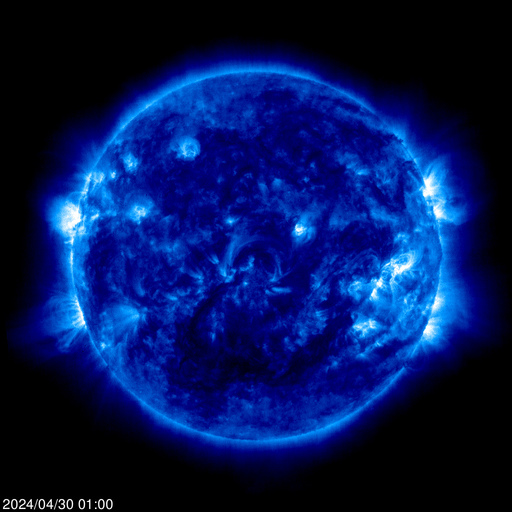
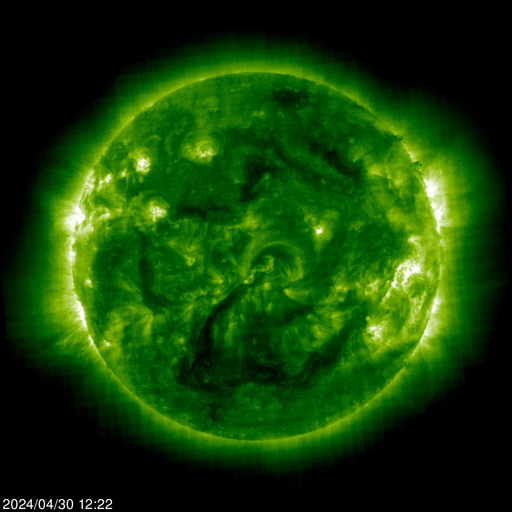
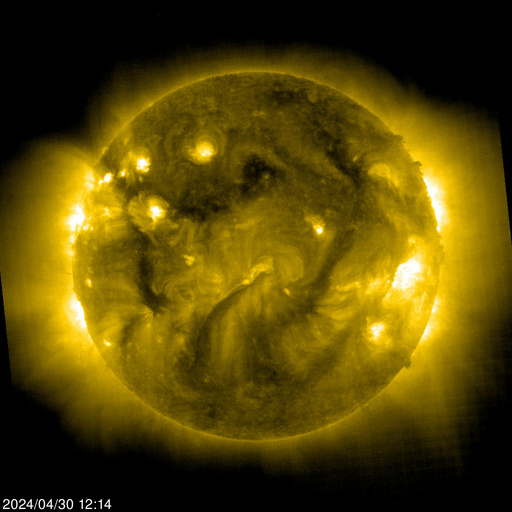
Sun Images
| eit 171 | eit 195 | eit 284 | eit 304 |
 |
 |
 |
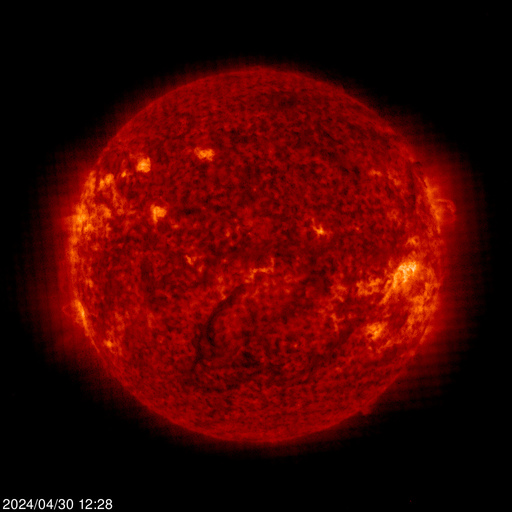 |
Images: From left to right: EIT 171, EIT 195, EIT 284, EIT 304 EIT (Extreme ultraviolet Imaging Telescope) images the solar atmosphere at several wavelengths, and therefore, shows solar material at different temperatures. In the images taken at 304 Angstrom the bright material is at 60,000 to 80,000 degrees Kelvin. In those taken at 171 Angstrom, at 1 million degrees. 195 Angstrom images correspond to about 1.5 million Kelvin, 284 Angstrom to 2 million degrees. The hotter the temperature, the higher you look in the solar atmosphere. | |||
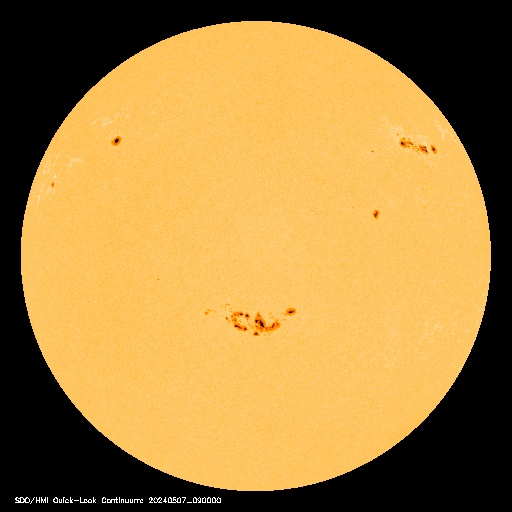
| SDO/HMI Continuum |
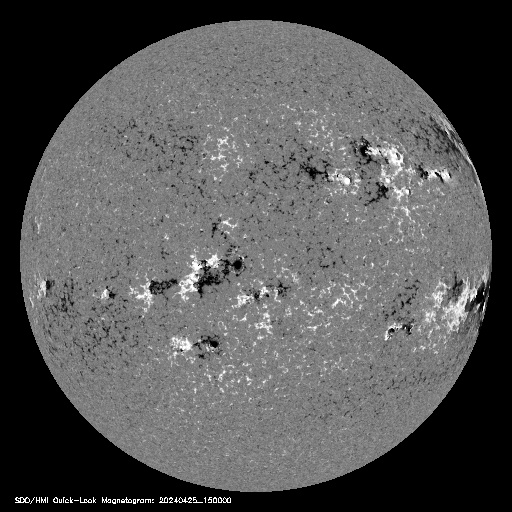
SDO/HMI Magnetogram |
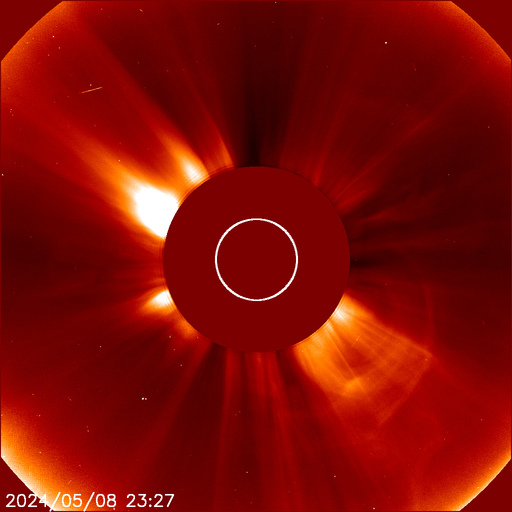
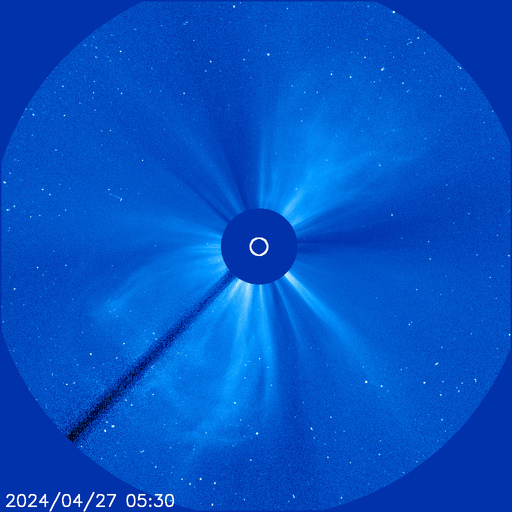
LASCO C2 | LASCO C3 |
 |
 |
 |
 |
The MDI (Michelson Doppler Imager) images shown here are taken in the continuum near the Ni I 6768 Angstrom line.
The most prominent features are the sun spots. |
LASCO (Large Angle Spectrometric Coronagraph) is able to take images of the solar corona by blocking the light coming directly from the Sun with an occulter disk, creating an artificial eclipse within the instrument itself. |
||
 for more information for more information | |||
Bigger versions of this page in a new window: New regular size page, New 1280×1024 window, and New 1600×1200 window. |
|||
Solar cycle
| Sunspot numbers | F10.7CM Radio flux | AP |
 |
 |
 |
| for more information | ||
The Solar Cycle is observed by counting the frequency and placement of sunspots visible on the Sun. Solar minimum occurred in December, 2008. Solar maximum in May, 2013. | ||
| Solar wind | Satellite impact | Xray flux |
 |
 |
 |
| for more information | for more information | for more information |
On the left: Real-Time Solar Wind data broadcast from NASA's ACE satellite. Middle: The Satellite Environment Plot combines satellite and ground-based data to provide an overview of the current geosynchronous satellite environment. Right: 3-days of 5-minute solar x-ray flux values measured on the SWPC primary and secondary GOES satellites. | ||
Auroral activity
| Northern Auroral map | Southern Auroral map |
 |
 |
Alerts
Introduction Movie
Conditions on the Sun and in the solar wind, magnetosphere, ionosphere and thermosphere that can influence the performance and reliability of space-borne and ground-based technological systems and can endanger human life or health. This introduction movie in the English language will open on a new tab/window when you click on the image below.
Also in Quicktime format: Large (269M) and Small ( 60M).
links
Space Weather links:
 Losts of interesting information
3-Day Forecast of Solar and Geophysical Activity
Space Weather overview
LASCO Coronagraph
Solar wind
Forecast discussion
Solar and Heliospheric Observatory (SOHO)
The Very Latest SOHO Images
Space Agencies:
European Space Agency (ESA)
Institute of Space and Astronautical Science (ISAS)
National Aeronautics and Space Administration (NASA)
Russian Space Agency
Credits:
Space Weather Images and Information (excluded from copyright) courtesy of:
NOAA / NWS Space Weather Prediction Center,
Mauna Loa Solar Observatory (HAO/NCAR),
and SOHO (ESA & NASA).
Apparatuur in gebruik:
Weerstation |
Weerprogramma |
Weercomputer |
Webleverancier |
|
|
|
|


5 gebruiker(s) online | | Valid HTML5 | Valid CSS
Baseer nooit belangrijke beslissingen op deze of andere weergegevens verkregen via Internet.